
GRACED, near-real-time Global Gridded Daily CO2 Emissions Dataset from fossil fuel and cement production
How to Cite the Data
Using Global gRidded dAily CO2 Emissions Dataset (GRACED) should cite the GRACED website (https://carbonmonitor-graced.com) and the following papers:
Dou, X., Wang, Y., Ciais, P., et al. Near-real-time global gridded daily CO2 emissions. The Innovation 3(1), 100182 (2022).https://doi.org/10.1016/j.xinn.2021.100182
Liu, Z., Ciais, P., Deng, Z. et al. Near-real-time monitoring of global CO2 emissions reveals the effects of the COVID-19 pandemic. Nat Commun 11, 5172 (2020).https://doi.org/10.1038/s41467-020-18922-7
Liu, Z., Ciais, P., Deng, Z. et al. Carbon Monitor, a near-real-time daily dataset of global CO2 emission from fossil fuel and cement production. Sci Data 7, 392 (2020).https://doi.org/10.1038/s41597-020-00708-7
Contributors
Xinyu Dou,1 Yilong Wang,2 Philippe Ciais,3 Frédéric Chevallier,3 Steven J. Davis,4 Monica Crippa,5 Greet Janssens-Maenhout,5 Diego Guizzardi,5 Efisio Solazzo,5 Feifan Yan,6 Da Huo,1 Zheng Bo,7 Biqing Zhu,1 Duo Cui,1 Piyu Ke,1 Taochun Sun,1 Hengqi Wang,1 Qiang Zhang,1 Pierre Gentine,8 Zhu Deng1 and Zhu Liu1*
1Department of Earth System Science, Tsinghua University, Beijing 100084, China
2Key Laboratory of Land Surface Pattern and Simulation, Institute of Geographical Sciences and Natural Resources Research, Chinese Academy of Sciences, Beijing 100101, China
3Laboratoire des Sciences du Climat et de l Environnement, LSCE/IPSL, CEA-CNRS-UVSQ, Université Paris-Saclay, Gif-sur-Yvette, France
4Department of Earth System Science, University of California, Irvine, CA, USA
5European Commission, Joint Research Centre (JRC), Ispra, Italy
6Key Laboratory of Marine Environment and Ecology, and Frontiers Science Center for Deep Ocean Multispheres and Earth System, Ministry of Education, Ocean University of China, Qingdao 266100, China
7Institute of Environment and Ecology, Tsinghua Shenzhen International Graduate School, Tsinghua University, Shenzhen 518055, China
8Department of Earth and Environmental Engineering, Columbia University, New York, NY, USA
*Correspondence:zhuliu@tsinghua.edu.cn
Fair use data policy
GRACED data are made freely available to the public and the scientific community in the belief that their wide dissemination will lead to greater understanding and new scientific insights.
The availability of these data does not constitute publication of the data. The data providers rely on the ethics and integrity of the user to ensure that they receive fair credit for their work.
If the data are obtained for potential use in a publication or presentation, we kindly ask you to inform us at the outset of the nature of this work. If the GRACED data are essential to the work, or if an important result or conclusion depends on the GRACED data, co-authorship may be appropriate. This should be discussed at an early stage in the work.
Manuscripts using the GRACED data should be sent to for review before they are submitted for publication so we can ensure that the quality and limitations of the data are accurately represented. Contacts about the data:
douxy19@mails.tsinghua.edu.cnorzhuliu@tsinghua.edu.cn
Disclaimer
GRACED data are made freely available to the public with a fair use open data policy. We encourage users to cite the data by the follwing papers.
GRACED is a living dataset subject to updates and the values are expected to change, as new data get included. In the process of updating our gridded daily CO2 emission products, errors may be corrected, revisions may be made in the calculation methods, and new information may be used. Data files available for download and maps are associated to a day of release.
In case of questions regarding data and history previous releases, please contact us at douxy19@mails.tsinghua.edu.cn or zhuliu@tsinghua.edu.cn. All information displayed and provided can be used at the own responsibility of users, and does not engage any responsibility from research institutions supporting GRACED and partner institutions.
What is GRACED?
Precise and high-resolution carbon dioxide (CO2) emission data is of great importance in achieving carbon neutrality around the world. Here our team presents for the first time the near-real-time Global Gridded Daily CO2 Emissions Dataset (GRACED) from fossil fuel and cement production with a global spatial resolution of 0.1° by 0.1° and a temporal resolution of 1 day.
GRACED responds to the growing and urgent need for high-quality, fine-grained, near-real-time CO2 emissions estimates to support global emissions monitoring across various spatial scales. Furthermore, it provides the most up-to-date and fine-grained overview of where and when fossil CO2 emissions have decreased and rebounded in response to emergencies (e.g., coronavirus disease 2019 [COVID-19]) and other disturbances of human activities of any previously published dataset. As the world recovers from the pandemic and decarbonizes its energy systems, regular updates of GRACED will enable policymakers to more closely monitor the effectiveness of climate and energy policies and quickly adapt.
Features of GRACED
Our team presents the first near-real-time Global Gridded Daily CO2 Emissions Dataset (GRACED).
GRACED can be updated in near real time with a spatial resolution of 0.1° and a temporal resolution of 1 day.
GRACED shows gridded emissions of seven sectors: power, industry, residential consumption, ground transport, domestic aviation, international aviation, and international shipping.
Regular updates of GRACED will enable policymakers to more closely monitor the effectiveness of climate and energy policies and quickly adapt on various spatial scales.
Background
Although human emissions of carbon dioxide (CO2) to the atmosphere are the main cause of global climate change, detailed and spatially-explicit estimates of such emissions are updated infrequently, typically lagging emissions by at least a year. However, with the rising ambition of climate policies and mitigation efforts,1,2 a reliable, spatially-explicit and up-to-date dataset of fossil CO2 emissions is becoming increasingly important. For example, such detailed data is necessary to link emissions to observable atmospheric concentration signals and constrain regional CO2 fluxes, and can help decision makers to more quickly assess both the effectiveness of policies and local priorities for further mitigation.3,4
Since the end of 2019, the COVID-19 pandemic has caused major disruptions of human activities and energy use. Governments around the world have imposed compulsory lockdowns that restrict in-person educational and commercial activities to reduce the spread of coronavirus. In turn, industries and factories reduced their activities and production, people s local and long distance mobility was reduced, and human activities were reduced on a large scale, resulting in a substantial decrease in fossil energy consumption and CO2 emissions, albeit with large regional differences.4-6 As lockdown restrictions have relaxed in many countries and economic activities have recovered in some sectors, the effect of the pandemic on CO2 emissions has weakened, even during large “second waves” of cases. A timely and finely-gridded emissions dataset enables quantitative analysis of how temporal and spatial changes in CO2 emissions in each country in response to emergencies (e.g. COVID-19) and other disturbances of human activities, and helps constraining predictions of future trends.
Existing datasets of global gridded (i.e. spatially-explicit) CO2 emissions include the Open-source Data Inventory for Anthropogenic CO2 (ODIAC) that distributes national emission totals estimated by the Carbon Dioxide Information Analysis Center (CDIAC) in space, using a combination of geospatial proxies such as satellite observations of nighttime lights and geolocations of major power plants(CARMA list): ODIAC provides maps of monthly CO2 emissions on a 1 km grid for the period 2000 to 2019, as of today, including emissions from power plant, transportation, cement production/industrial facilities, and gas flares over land regions.7-9 Similarly, the Community Emissions Data System (CEDS) uses data from a number of existing inventories to provide a monthly gridded dataset of all emission species for the Climate Model Inter-comparison Program (CMIP6) over the period 1750 to 2014 at a resolution of up to 0.1°, including sectors of energy transformation and extraction, industry, residential, commercial, transportation, agriculture, solvent production and application, waste, shipping and “other”.10-13 Another prominent example is the Emission Database for Global Atmospheric Research (EDGAR). EDGAR estimates emissions based on national CO2 emissions reported by the Global Carbon Project (GCP) and emission factors, broken down to IPCC-relevant source-sector levels. EDGAR uses spatial geospatial proxies such as point and line source locations at a 0.1°×0.1° resolution for the period 1970 to 2019, including sectors of agriculture, power, transport, residential, industry, manufacturing, and a number of others.14-17 More recently, The Global Carbon Grid (http://gidmodel.org) establishes high-resolution maps of global CO2 emissions from fossil fuel combustion and cement production based on a framework that integrates multiple data flows including point sources, country-level sectoral activities and emissions, and transport emissions and distributions. The Global Carbon Grid v1.0 provides global 0.1°×0.1° CO2 emission maps of six source sectors, including power, industry, residential, transport, shipping, and aviation in 2019.18-20
Even the most current of the gridded CO2 emissions datasets described above lag emissions by a year or more and do not reflect sub-monthly temporal variations related to seasonality, weather, economic activities, or policies. Nassar et al. made a first attempt to further downscale these global datasets at the weekly and diurnal scale using static local temporal scaling factors.21 However, during a normal year, day-to-day variations are due mainly to weather impacting heating/cooling demands of residences and commercial buildings and the generation of renewable energy, as well as weekends and holidays. Since the pandemic began in early 2020, though, daily variations have been perturbed by a multitude of other factors, including lockdowns, industrial production drops and recoveries, and changes in human behavior. Timely and quantitative analysis on the effects of these COVID-related changes on CO2 emissions using tools such as inversion systems thus requires dynamic knowledge of global CO2 emissions. It was this need for data that led to our development of the Carbon Monitor, a near-real-time daily dataset of global CO2 emission at the national level (https://carbonmonitor.org).3,4 Chevallier et al. disaggregated the daily national Carbon Monitor totals on a worldwide uniform grid using satellite retrievals of a pollutant co-emitted with CO2 as a spatial proxy, without sectoral distinction.22 Here, we considerably refine the approach by downscaling the daily national emissions from Carbon Monitor into a 0.1° × 0.1° grid for each of the seven sectors (power, industry, residential, ground transportation, domestic aviation, international aviation, and international shipping), using sector-specific geospatial data from the Global Carbon Grid (GID) v1.0, the EDGARv5.0_FT2019 database for 2019, and NO2 retrievals from the Tropospheric Monitoring Instrument (TROPOMI) on board the Sentinel-5 Precursor satellite to provide a new spatially-explicit dataset of daily global CO2 emissions covering the last two years since January 1, 2019, which we name GRACED. The first high-resolution near-real-time gridded fossil CO2 emission emissions GRACED we presented will facilitate the adaptive management of emissions and the implementation of climate policy, which is of great importance of achieving the carbon neutrality around the world.
MATERIALS AND METHODS
Datasets used in the study
(1) A near-real-time daily dataset of global sectoral CO2 emission from fossil fuel and cement production at national level since January 1, 2019 published as Carbon Monitor (data available at https://carbonmonitor.org/).4
(2) Global sectoral CO2 emissions annual data with high-resolution of 0.1° in 2019 based on a framework that integrates multiple data flows including point sources, country-level sectoral activities and emissions, and transport emissions and distributions released by the Global Carbon Grid (http://gidmodel.org).18-20,23-25
(3) Global monthly gridded emissions at a 0.1°×0.1° resolution in 2019 defined for a large number of IPCC sub-sectors provided by the Emission Database for Global Atmospheric Research (EDGAR) (https://edgar.jrc.ec.europa.eu/overview.php?v=50_GHG).16,26
(4) Daily NO2 TCVD retrievals data in 2019 and 2020 from the Tropospheric Monitoring Instrument (TROPOMI) on board the Sentinel‐5 Precursor satellite, launched in October 2017.
Spatial gridding methodology
Grouping the GID and EDGAR sectors into Carbon Monitor categories.Firstly, we link the Carbon Monitor emission sectors to GID and EDGAR sectors according to Table S1. We consider that GID has the highest accuracy in source location and we rely on this database as much as possible. However, for the domestic aviation, international aviation, and international shipping sector, GID does not distinguish between related domestic and international sub-sectors: we therefore directly use EDGARs monthly spatial patterns for the spatial distribution in these sectors.
Spatially gridding procedure.Secondly, we do spatially gridding procedure. We use the global annual spatial patterns of CO2 emission from the GID sub-sectors and global monthly CO2 emission spatial patterns from EDGAR sub-sectors for the year 2019 for spatially downscaling Carbon Monitor daily national-level emissions. We assume that the spatial pattern of emissions remained unchanged after the last year of GID and EDGAR (2019). The validity of this assumption will depend on the country and on the time horizon for the adjustment. While, the sub-national emission may change rapidly within a country from 2019 to 2020 as there was a great difference in the timing and degree of the impact of COVID-19 in various regions. Therefore, for large emitters that have a significant impact on global total emissions, we use sub-national proxy based on TROPOMI NO2 retrievals data to allocate national Carbon Emission totals into regional totals, before doing a second down-scaling at 0.1° based on the GID and EDGAR spatial patterns. The analysis can be updated consistently with the latest high-resolution emission maps and other spatial proxies for each year.
The spatial disaggregation framework used in the GRACED is shown in Figure 1. It is a top-down methodology that allocates Carbon Monitor national-level daily emissions to finer grid cells using spatial patterns provided by GID and EDGAR and sub-national proxy based on TROPOMI NO2 retrievals.
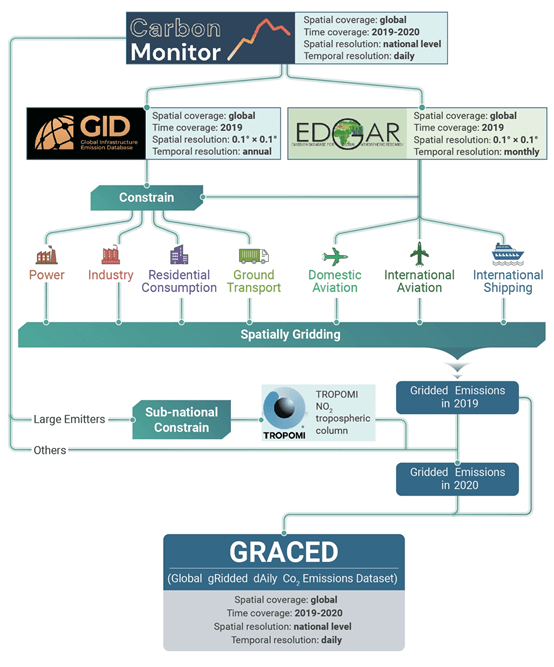
Figure1. The framework of top-down spatially gridding methodology.
After revising the gridded emissions for large emitters Brazil, China, France, Germany, India, Italy, Japan, Spain, US, and UK in 2020, GRACED is finally generated.
CodeAvailability
The code generated during and/or analyzed during the current study are available from the corresponding author. After peer-reviewed the code will be open accessible on the GRACED website (https://carbonmonitor-graced.com).
References
1
Chen, J.M. (2021). Carbon Neutrality: Toward a Sustainable Future. The Innovation 2, 100127,https://doi.org/10.1016/j.xinn.2021.100127
2
Wang, F., Harindintwali, J., Yuan, Z., et al. (2021). Technologies and perspectives for achieving carbon neutrality. The Innovation 2, 100180,https://doi.org/10.1016/j.xinn.2021.100180
3
Liu, Z., Ciais, P., Deng, Z., et al. (2020). Carbon Monitor, a near-real-time daily dataset of global CO2 emission from fossil fuel and cement production. Nature Scientific Data 7, 392, 10.1038/s41597-020-00708-7.
4
Liu, Z., Ciais, P., Deng, Z., et al. (2020). Near-real-time monitoring of global CO2 emissions reveals the effects of the COVID-19 pandemic. Nature communications 11, 1-12.
5
Forster, P.M., Forster, H.I., Evans, M.J., et al. (2020). Current and future global climate impacts resulting from COVID-19. Nature Climate Change 10, 913-919.
6
Le Quéré, C., Jackson, R.B., Jones, M.W., et al. (2020). Temporary reduction in daily global CO2 emissions during the COVID-19 forced confinement. Nature Climate Change 10, 647-653.
7
Oda, T., Maksyutov, S., and Andres, R.J. (2018). The Open-source Data Inventory for Anthropogenic CO 2, version 2016 (ODIAC2016): a global monthly fossil fuel CO2 gridded emissions data product for tracer transport simulations and surface flux inversions. Earth System Science Data 10, 87-107.
8
Oda, T., and Maksyutov, S. (2011). A very high-resolution (1 km×1 km) global fossil fuel CO2 emission inventory derived using a point source database and satellite observations of nighttime lights. Atmospheric Chemistry and Physics 11, 543-556, 10.5194/acp-11-543-2011.
9
ODIAC (2021). ODIAC Fossil Fuel Emission Dataset. In C.f.G.E. Research, ed. ODIAC2020b ed.
10
Hoesly, R.M., Smith, S.J., Feng, L., et al. (2018). Historical (1750–2014) anthropogenic emissions of reactive gases and aerosols from the Community Emissions Data System (CEDS). Geoscientific Model Development 11, 369-408.
11
McDuffie, E.E., Smith, S.J., ORourke, P., et al. (2020). A global anthropogenic emission inventory of atmospheric pollutants from sector-and fuel-specific sources (1970–2017): an application of the Community Emissions Data System (CEDS). Earth System Science Data 12, 3413-3442.
12
O Rourke, P.R., and Smith, S. (2019). Global Air Pollutant Emissions Estimates to 2018 and Community Emissions Data System (CEDS) Project Updates. AGU Fall Meeting Abstracts.
13
Smith, S.J., Zhou, Y., Kyle, P., et al. (2015). A Community Emissions Data System (CEDS): Emissions for CMIP6 and Beyond. Proceedings of the 2015 International Emission Inventory Conference, San Diego, CA, USA.
14
Crippa, M., Guizzardi, D., Muntean, M., et al. (2020). Fossil CO2 emissions of all world countries - 2020 Report 10.2760/143674.
15
Janssens-Maenhout, G., Crippa, M., Guizzardi, D., et al. (2015). HTAP_v2. 2: a mosaic of regional and global emission grid maps for 2008 and 2010 to study hemispheric transport of air pollution. Atmospheric Chemistry Physics 15, 11411-11432.
16
anssens-Maenhout, G., Crippa, M., Guizzardi, D., et al. (2019). EDGAR v4. 3.2 Global Atlas of the three major greenhouse gas emissions for the period 1970–2012. Earth System Science Data 11, 959-1002.
17
Crippa, M., Guizzardi, D., Muntean, M., et al. (2019). EDGAR v5.0 Greenhouse Gas Emissions.
18
Tong, D., Zhang, Q., Davis, S.J., et al. (2018). Targeted emission reductions from global super-polluting power plant units. Nature Sustainability 1, 59-68.
19
Wang, X., Lei, Y., Yan, L., et al. (2019). A unit-based emission inventory of SO2, NOx and PM for the Chinese iron and steel industry from 2010 to 2015. Science of the total environment 676, 18-30.
20
Liu, J., Tong, D., Zheng, Y., et al. (2021). Carbon and air pollutant emissions from China s cement industry 1990–2015: trends, evolution of technologies, and drivers. Atmospheric Chemistry and Physics 21, 1627-1647.
21
Nassar, R., Napier‐Linton, L., Gurney, K.R., et al. (2013). Improving the temporal and spatial distribution of CO2 emissions from global fossil fuel emission data sets. Journal of Geophysical Research: Atmospheres 118, 917-933.
22
Chevallier, F., Zheng, B., Broquet, G., et al. (2020). Local anomalies in the column‐averaged dry air mole fractions of carbon dioxide across the globe during the first months of the coronavirus recession. Geophysical research letters 47, e2020GL090244.
23
Meijer, J.R., Huijbregts, M.A., Schotten, K.C., and Schipper, A.M. (2018). Global patterns of current and future road infrastructure. Environmental Research Letters 13, 064006.
24
Zheng, B., Huo, H., Zhang, Q., et al. (2014). High-resolution mapping of vehicle emissions in China in 2008. Atmospheric Chemistry and Physics 14, 9787-9805.
25
Liu, H., Fu, M., Jin, X., et al. (2016). Health and climate impacts of ocean-going vessels in East Asia. Nature climate change 6, 1037-1041.
26
Crippa, M., Solazzo, E., Huang, G., et al. (2020). High resolution temporal profiles in the Emissions Database for Global Atmospheric Research (EDGAR). Nature Scientific Data 7, 1-17.